Office Market

1 – Minute Phoenix Metro Office Market Update: Q1 2023

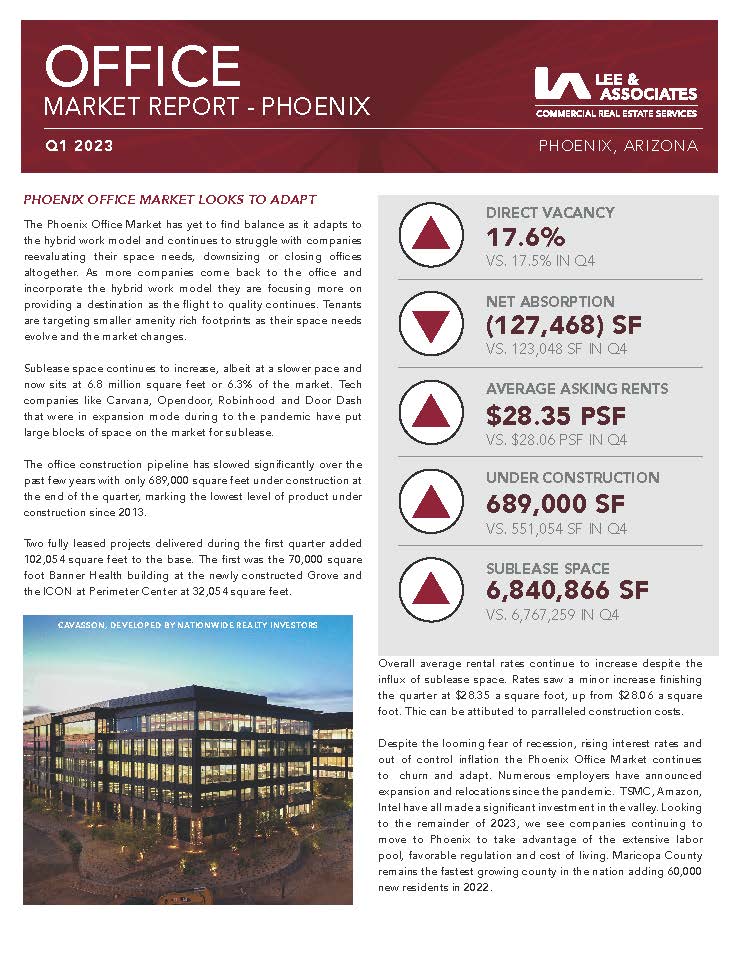
The Metro Phoenix Office Market continues to face significant headwinds in 2023.  Net absorption, measured by the net change in physically occupied space, came in at negative 127,468 square feet in Q1. This means the office recovery took a step backward after realizing positive net absorption in the same amount during the last quarter of …

1 – Minute Phoenix Metro Office Market Update: Q1 2023 Read More »

4th Quarter Recent Transactions: Strong Start to 2023

The demise of office space is over exaggerated…  If you look at our team’s business, we continued to close a transaction every 2 days over the last quarter.  C2 is representing, touring, negotiating, and closing deals. –We would love to work with you. –We know the market….todays’ market. –We have insider information on deal terms …

4th Quarter Recent Transactions: Strong Start to 2023 Read More »

1-Minute Phoenix Metro Office Market Update: Q4 2022

The Metro office market continues to trudge along its own path of an extended (up and down, circular) recovery.  Direct vacancy actually decreased slightly to 17.5%, 500 basis points lower than our 20-year average.  Meanwhile, average asking rates actually increased by $0.46/SF per year between Q3 and Q4.  However, net absorption, the most critical indicator of market …

1-Minute Phoenix Metro Office Market Update: Q4 2022 Read More »

1-Minute Phoenix Metro Office Market Update: Q3 2022

The Metro Phoenix Office Market hit a small speedbump in Q3 on the path to recovery. After posting a big net absoption in Q2 of +918,413 SF, Q3 slipped to -81,621 SF. This puts year-to-date net absorption at +532,634 SF, on track to finish well below our 20-year average of 2 million SF. What’s going with …

1-Minute Phoenix Metro Office Market Update: Q3 2022 Read More »

Scroll to Top
Skip to content